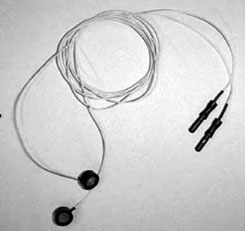
8mm diameter silver-silver chloride
SC electrodes type EL22
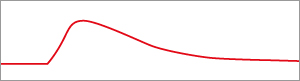
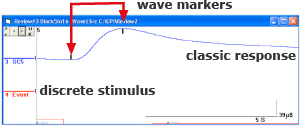
A classic SCR (SC Response) to a discrete stimulus is shown in the red trace, with its characteristic onset, rise time, peak, and exponential decay, sometimes measured as 'half recovery time'.
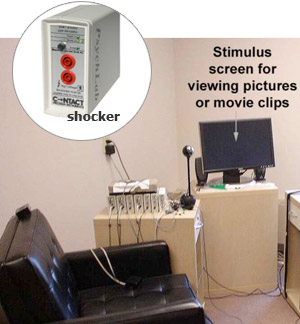
The subject room
SKIN CONDUCTANCE EXPLAINED
SC basics
Conductance instead of resistance
Designing the experiment
SC recording with MRI
Designing an experiment with specific responses
Non-specific response experiments
The PsychLab SC instrument provides for high resolution skin conductance measurement to produce publishable data. The system accommodates a wide variety of experiment including showing pictures, playing sounds, and recording synchronized video in computer file. fMRI applications are also supported.
SC BASICS
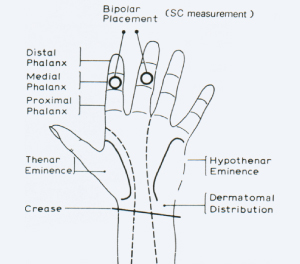
Skin conductance (SC) is normally measured with 8mm diameter silver/silver chloride electrodes positioned on the medial phalanx of the index and middle fingers held in position by double sided sticky electrode collars. A non-saline jell is used. SC response (SCR) provides an indication of arousal.
Skin Conductance is also known as Galvanic Skin Response (GSR) or Electrodermal activity (EDA), but Skin Conductance is the currently used term. It is based in the primitive 'fight or flight' response, whereby the body prepares itself for the exertion needed to deal with a perceived threat by increasing sweat activity to cool itself. At low levels, this happens all the time, as the mind experiences thoughts and emotion. Sensitive response to thoughts is only found at two places on the body, the hand and foot. Two sites on the hand may be used, medial phalange of the fingers, or palm. The site used on the feet (rarely) is at the heel. See Martin & Venables, Handbook of Psychophysiology, 1979. A classic SCR (SC Response) to a discrete stimulus is shown in the red trace, with its characteristic onset slope, rise time, peak, and exponential decay, sometimes measured as 'half recovery time'. There is a delay between stimulus and SC response, usually considered to be a minimum of 0.8 seconds. For this reason studies which look at discrete responses apply a time window in the analysis such that responses are only accepted if the onset lies between 0.8 (or 1) second and usually 4 seconds after the stimulus. Later than this will be considered a non-specific response (NSR) also called a spontaneous response (SR); not a stimulus elicited response. The abbreviations SR and NSR are correct terms for use in publications. Responses are also screened by amplitude, a minimum response amplitude of 0.02 micro Siemens may be required.
CONDUCTANCE INSTEAD OF RESISTANCE
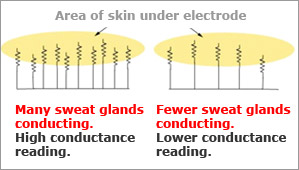
The reason for using conductance instead of resistance lies in the understood model for skin conductivity. As perspiration increases, more sweat glands begin to conduct electricity in a given area of skin.
This is as opposed to a model whereby there is a constant number of sweat glands per skin area, and the conductivity of each sweat gland varies depending on degree of perspiration. This former model is one of a varying number of parallel resistances. The electrical formula for calculating parallel resistance is: 1/(total resistance)= 1/(resistance1) + 1/(resistance2) etc. whereas for parallel conductance it is more simply: total conductance = conductance1 + conductance2 etc. Thus it makes sense to use conductance rather than resistance. The unit for skin conductance is microSiemens.
To measure SC, a very small voltage is applied across these electrodes (0.5V). By measuring the current that flows, conductance can be measured. By Ohms law, Resistance = Voltage divided by Current, therefore Conductance = Current divided by voltage, the reciprocal of resistance. The unit of resistance is the Ohm, and Conductance used to be expressed as Mho, but the preferred unit of conductance is microSiemens. It is the reciprocal of MegOhm. Zero resistance (a short circuit) is infinite conductance, 1 MegOhm is 1 microSiemens, 2 MegOhms is 0.5 microSiemens, 100kOhms is 10 microSiemens, and so on.
DESIGNING THE EXPERIMENT
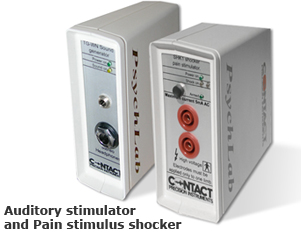
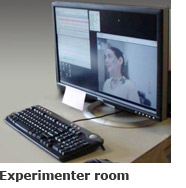 PsychLab measuring software allows other measures to be mixed with SC. User programmed events can be scheduled as required while data acquisition proceeds, including stimulator control. It accommodates auditory and visual stimulation. Pictures may be shown using intelligent script to design picture order, timing, and so on. For picture or movie presentation, a second monitor is normally required, using windows ‘extended desktop' mode which allows two computer monitors to display different things under control of one program. Pseudo random and true random functions are available. Orienting response, habituation, conditioning and other studies may be performed with this highly flexible, user programmable software. Our stimulators for UCS include loud noise or electric shock.
SC RECORDING WITH MRI
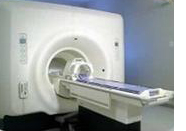 A long shielded input cable is used allowing SC to be recorded in the adverse magnetic environment. Conventional silver/silver chloride electrodes have been found not to interfere with MRI performance when placed at the distance of the hand of the subject. The SC amplifier is positioned outside the faraday cage.
Please ask for further details about this application.
DESIGNING AN EXPERIMENT WITH SPECIFIC RESPONSES
This is the event related type of experiment, where there are clearly defined discrete stimuli which may elicit SC responses. Normally the stimulus will be repeated for a number of trials, with randomized or pseudo random variation of interval between trials. It is important when designing the experiment to leave sufficient time between stimuli, so that each discrete response can be windowed and quantified. An SCR typically takes 4 or 5 seconds to complete, and onset may be up to 4 seconds from stimulus onset. Experiments may be designed with as short as 8 seconds between stimuli, but to be comfortable, 12 – 15 seconds is better. There is often a compromise that must be made to avoid the experiment becoming so long that the subject loses interest.
The PsychLab wave detection system was originally designed for detecting Skin Conductance responses in 1986 and has been used for published SC analysis since then. The Wave Review can produce the following information:
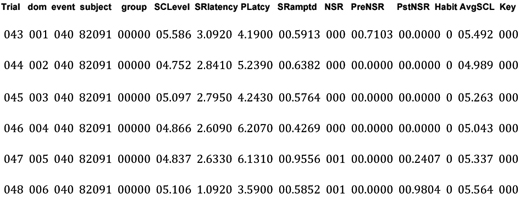
The intelligent macro script facility in PsychLab data analysis allows sophisticated procedures to be implemented which in addition to windowing and scoring SR can identify habituation trial and also produce information about second or late responses and those that occur before the response window. In the example result data shown, the third from right column shows habituation, if it occurred. Trials in the data are in groups of 8, such a group of trials is called a domain. The 3 rd column from left shows trial grouping. Habituation occurred in trial 6 of type 60 domain. This is a very complex example of specific response SC analysis.
WAVE DETECTION ALGORITHM PRODUCES
• Onset level of each wave.
• Onset latency (from block stimulus event) for each wave.
• Amplitude of each wave.
• Total amplitude of all waves in each channel.
• Count of waves in each channel.
• Peak latency of each wave.
NON-SPECIFIC RESPONSE EXPERIMENTS
Generally studies involving picture stimulus are dealt with in the non-specific category, because response to pictures may not be immediate. Other types of experiment in this category are emotion work, drug trials, and any procedure where there is not a specific stimulus. Non-specific response experiment usually will have some way of identifying different stages in the procedure, whether that be an interview, presentation of movie clip, and so on.
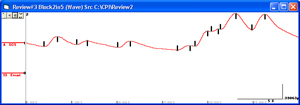
The method used for NSR SC analysis is to collect total responses that occur in different stages of the procedure. In the case of picture presentation, responses are counted while the picture is shown. It is helpful when comparing response count in different stages if they are counted in a uniform time epoch, therefore each stage of the procedure might be broken up into as many time epochs as fit that stage, if it is of indeterminate duration. Data are then produced for each stage, using the wave algorithm to count responses and also quantify total response amplitude. The latter is not frequently used in published research, but arguably provides more sensitive data.
Example results for specific response analysis with habituation.
Wave detection may be used for both SC Specific Response (SR) and Non-specific Response (NSR) detection. With SR, normally the amplitude of the first wave detected in the defined time window is produced, and possibly latency of onset.
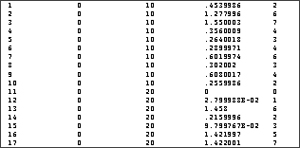
The table shows typical format for NSR data, where each line is the data for one 30 second time epoch. The rightmost colun is the count of responses, the next is total response amplitude in that time epoch.